Accessing the SALES TREND REPORT
Contents
Overview
This topic contains instructions on how to access the SALES TREND REPORT.
Instructions
To access the SALES TREND REPORT, perform the following steps:
- Log into the REPORTS dashboard (see the Accessing the REPORTS Dashboard topic for more information).
- Navigate to the Dashboards drop-down menu on the upper left portion of the dashboard and hover over the icon.
- Select the Home option from the drop-down menu.
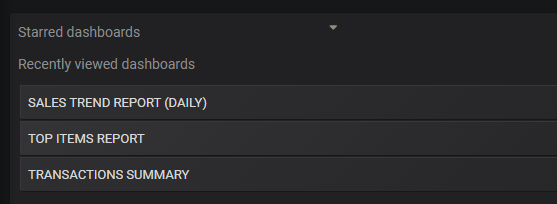
- When the Home Dashboard appears on the screen, select the SALES TREND REPORT(DAILY) option from the menu.
The SALES TREND REPORT (DAILY) appears on the screen. It contains the Transaction Amounts, the Successful/Unsuccessful Transactions, and the Unique Users Trend panels. This report lists the sales trends in a specific time period (in the example below the time period is the Last 30 days). Each panel also contains a data legend on the bottom left (in this example the legend contains color indicators for Total Amount, Successful Amount, and Unsuccessful Amount).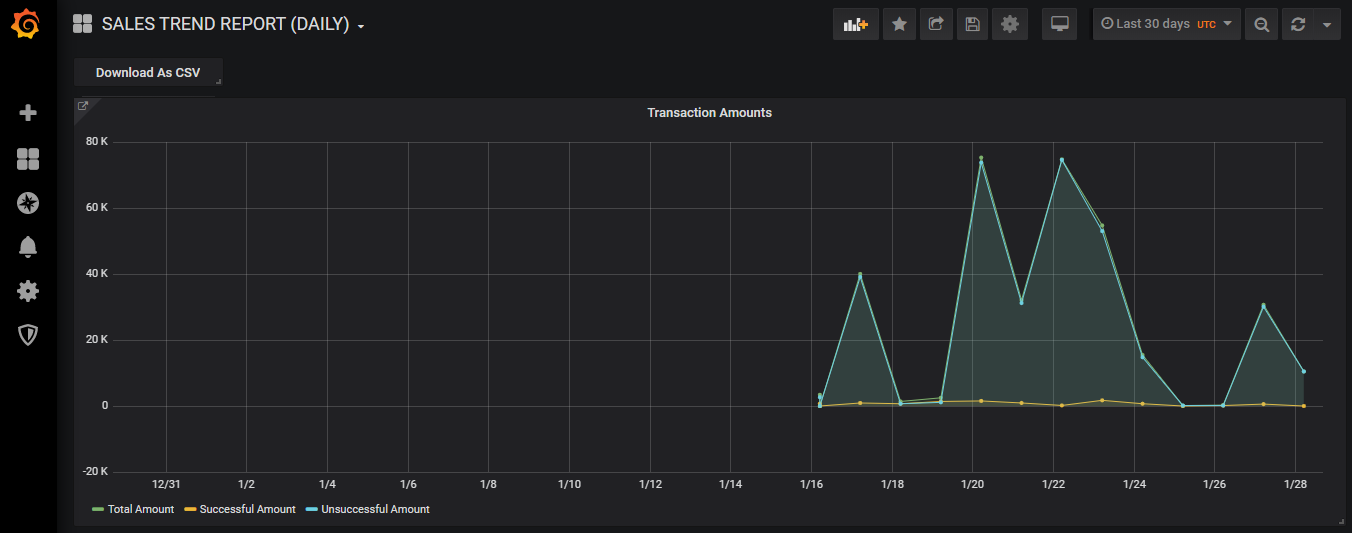
The data associated with each panel is dynamically displayed by hovering over the graph with your cursor, and moving it along the graph. For example, in the Transactions Amounts panel the Total Amount, Successful Amount, and Unsuccessful Amount data is conveniently displayed in a pop-up window for each time period.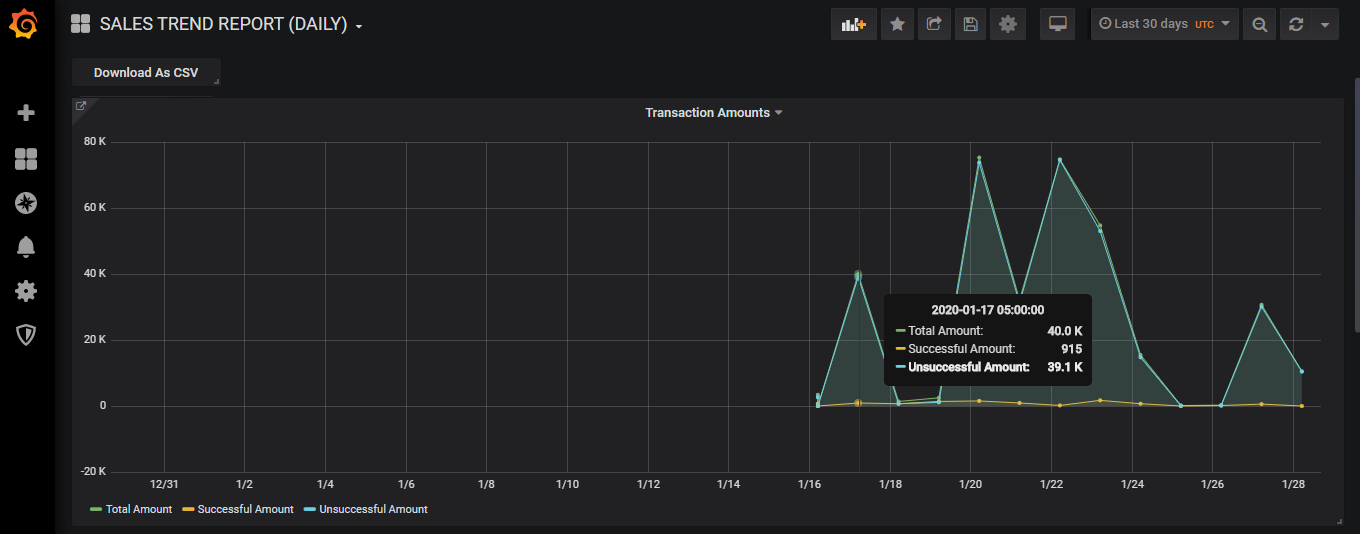
Note: This dynamic functionality can also be used in the Successful/Unsuccessful Transactions and the Unique Users Trend panels.
Revision History
| Version | Description |
|---|---|
| 2020.01 | Added this topic. |